
Search any version of this question and you get the same object back: a table of brewing methods with a micron range beside each one. Espresso 200 to 400. Pour over 400 to 900. French press somewhere around a millimetre. The numbers look like measurements, and the tables look like each other, which is usually a sign that everyone is copying from the same place.
They are not copying from a standards body. I went looking for where the numbers come from, and the short version is this: the three documents that were actually obliged to define a coffee grind all refuse to give a single number, and the one laboratory that has published measured medians for drip brewing put them roughly where the charts say French press.
| What it says | Who says it | What kind of thing it is |
|---|---|---|
| A grind is three sieve fractions, not a number — 70% above 600 µm, 20% above 425 µm, 10% below, with tolerances | ISO 6668:2008, Table 1 | International standard |
| The grind depends on the shape of your basket, not the name of the method — conical and flat baskets get different distributions | SCA 310-2021, Table 2 | Brewer certification test |
| Drip was measured at 770, 928 and 1,115 µm — and called fine, medium and coarse | Frost 2019 · Batali 2020, UC Davis | Laser diffraction, in triplicate |
| The most-linked chart sources its numbers to reader feedback | Honest Coffee Guide | Its own methodology line |
The last row is not a cheap shot. That page is the clearest of the lot, precisely because it tells you. Most of the others tell you nothing.
Affiliate links. Some links below go to Amazon. If you buy through one I earn a commission at no extra cost to you, and it never changes which product gets named or what the measurements say. Full disclosure.
The chart everyone publishes
Take the two grind charts that rank hardest for this search and lay them side by side. They are not a little different. They are different by more than the width of most of the bands they publish.
| Method | Honest Coffee Guide | I’m Not a Barista | Gap |
|---|---|---|---|
| Espresso | 180–380 µm | 180–380 µm | — |
| Moka pot | 360–660 µm | 360–660 µm | — |
| V60 / pour over | 400–700 µm | 400–950 µm | +250 µm at the top |
| Cupping | 460–850 µm | 700–1,200 µm | +240 / +350 µm |
| French press | 690–1,300 µm | 1,000–1,200 µm | +310 µm at the bottom |
| Cold brew | 800–1,400 µm | 900–1,500 µm | +100 µm |
Two methods match exactly, which tells you they share an ancestor. The other four do not, and the disagreement on French press is 310 µm at the low end — wider than the entire espresso band both of them agree on.
Now the interesting part, which is what each page says about where its figures came from. Honest Coffee Guide, to its credit, answers directly:
“The data from this tool is based on hands-on research and feedback from coffee enthusiasts like you!”
That is crowd-sourced, and saying so is more honest than most of this search manages. The competing chart takes the opposite position, arguing that a micron value is itself the proof of measurement:
“Measuring in microns removes all the ambiguity: ‘medium grind’ could mean anything, but 700 µm is 700 µm, measured by laser particle analysis. When a grind size chart uses micron values, someone actually measured the coffee — not just squinted at it.”
I have no reason to doubt that page runs its own particle analysis; it describes using a dynamic image analyser for consistency work. What it never says is whether the ranges in its main chart came from those runs. And that matters, because if both charts were measurements of the same thing they would not be 300 µm apart on cupping.
When two charts that both claim measurement disagree by a third of a millimetre, the thing being measured is not the coffee. It is the definition.
The three documents that had to define a grind
There are three places where somebody was forced to write down what a coffee grind is, because a test result depended on it. All three chose the same form, and it is not a micron figure.
ISO 6668:2008
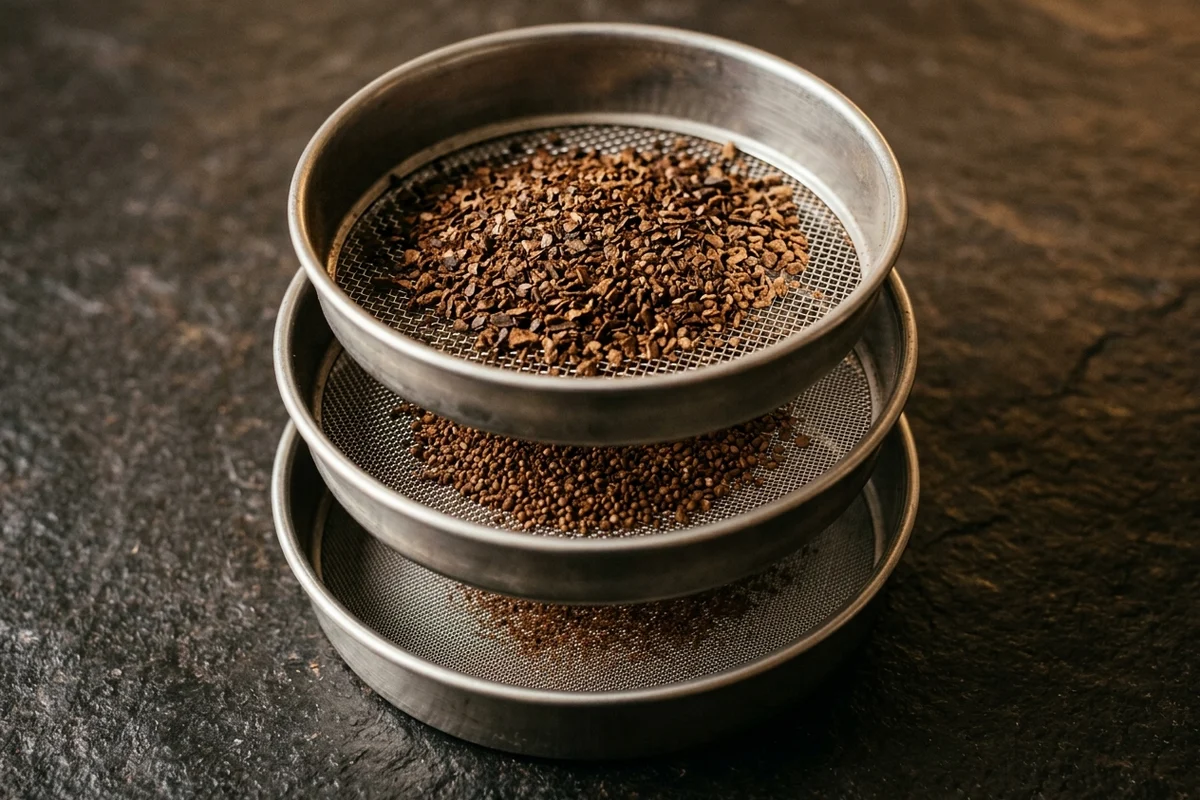
The international standard for preparing coffee samples for sensory analysis specifies the grinder in clause 6.4 as one that can grind roughly 100 g in under a minute to the particle size distribution in its Table 1:
| Mass fraction | Target | Max | Min |
|---|---|---|---|
| Retained on a 600 µm sieve | 70% | 75% | 60% |
| Retained on a 425 µm sieve | 20% | not specified | not specified |
| Through a 425 µm sieve | 10% | 15% | 5% |
The sieves have to comply with ISO 565, R 40/3. And then, in a single line under the table, the standard adds the part that no chart carries:
“Perform a test sieving at the start of each working day.”
The people who wrote the specification did not believe you could find a setting once and trust it. They required it to be re-verified every morning.
The SCAA cupping protocol
The 2005 cupping protocol, still the reference for how coffee is graded, writes the grind as a single sieve fraction and a comparison:
“Grind particle size should be slightly coarser than typically used for paper filter drip brewing, with 70% to 75% of the particles passing through a U.S. Standard size 20 mesh sieve.”
A US No. 20 sieve is 850 µm under ASTM E11, and its ISO 3310-1 equivalent has the same nominal opening. So the protocol is saying: about a quarter to a third of the mass should be coarser than 850 µm.
Hold on to the first half of that sentence, though, because it is a claim about drip and it will come back: cupping is defined as coarser than filter brewing. Several published charts put cupping and filter in overlapping bands, and one puts filter coffee’s range partly coarser than cupping’s. Under the protocol’s own definition, that is backwards.
There is also a practical test of how tightly this pins anything down. When Chris Kornman and Elise Becker sifted the output of five Mahlkönig EK43 grinders through Kruve screens for Roast Magazine, they worked out which settings satisfy the SCA’s wording. The answer was anywhere from setting 4 to setting 9 on their calibrated grinder — a five-setting band — and their own verdict on the specification was that it is poorly defined. When they then sifted cupping grinds from five Bay Area roasters, none of them matched the fine end of the SCA language.
SCA 310-2021, and the part nobody quotes
This is the one that changed how I think about the whole format.
Standard 310-2021 is the test a home brewer has to pass to be certified. Its brew ratio is written to four significant figures and its thermocouples have a stated tolerance, so it is not a document that avoids numbers. Clause 7.1.3 handles the grind — and it does not organise it by brewing method:
“All testing shall commence with the coffees from 7.1.2 ground to a common particulate distribution chosen to systematize the testing process, depending on the shape of the brew basket.”
Then Table 2 gives two distributions:
| Conical brew basket | By mass | Flat brew basket | By mass |
|---|---|---|---|
| Above 850 µm | ≤ 12% | Above 1,168 µm | ≤ 17% |
| 425–850 µm | ≥ 68% | 589–1,168 µm | ≥ 65% |
| Below 425 µm | ≤ 20% | Below 589 µm | ≤ 18% |
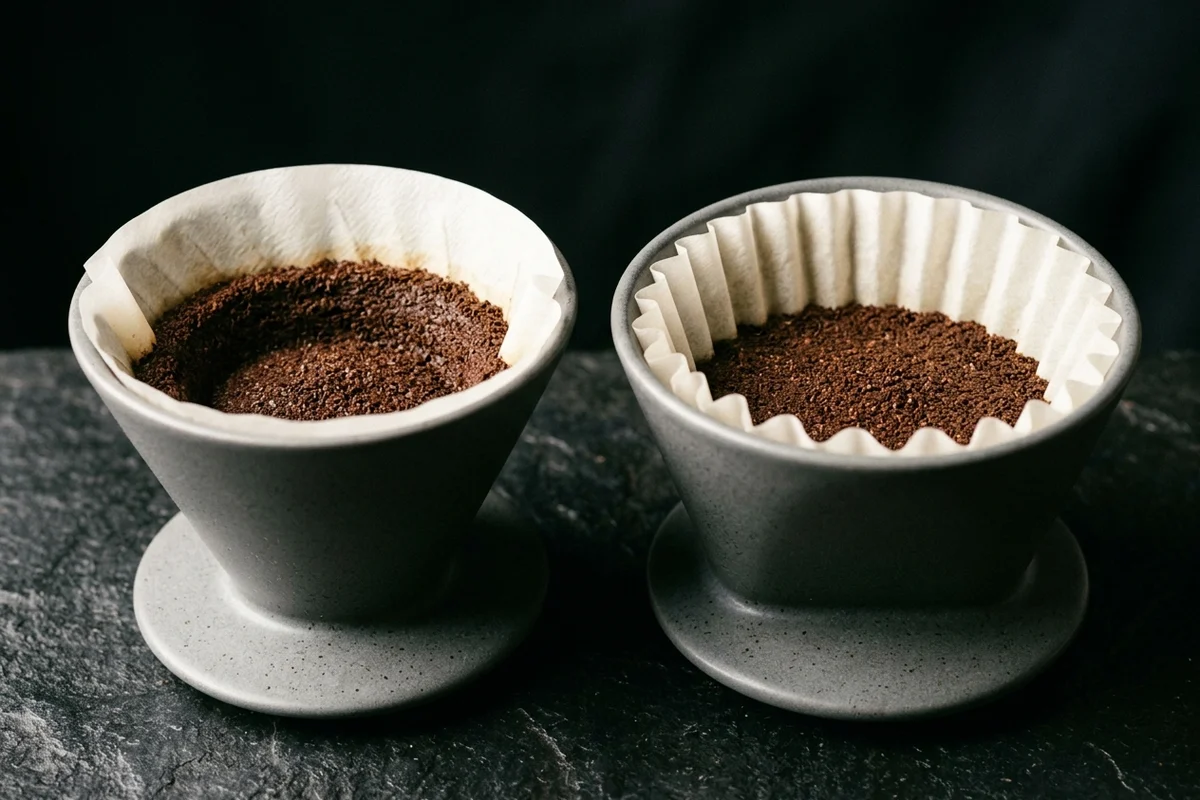
Read those two columns against each other. Same coffee, same target extraction, same standard — and the conical basket wants two thirds of its mass between 425 and 850 µm while the flat basket wants two thirds of its mass between 589 and 1,168 µm. The entire distribution moves, in some places by more than 300 µm, because of the shape of the thing the coffee is sitting in.
There is no brewing method in that table. “Pour over” is not a grind size. A cone and a flat bed are two different grinds, and the standards body that certifies brewers wrote that down in 2021. (That is the shape of the basket. The other conical-versus-flat question, about the burrs, has evidence of its own.)
One note in fairness to the document: its prose gives the flat-basket middle band as 589–1198 µm while Table 2 gives 589–1168 µm, a 30 µm discrepancy between the sentence and the table beneath it. I have used Table 2’s figure, because it is internally consistent with the row above it, and I am flagging the difference rather than quietly picking one.
What a laboratory measured for drip
Here is the comparison that does the most damage to the charts.
Two studies from the University of California, Davis used the same grinder — a Mahlkönig Guatemala Lab — at settings 3, 4 and 5, and measured what came out. Frost, Ristenpart and Guinard used a Sympatec HELOS/RODOS laser analyser with an 18 to 3,500 µm lens, in triplicate. They reported medians of approximately 800, 1,000 and 1,200 µm. The following year, Batali and colleagues published the same three settings with tighter figures: 770 ± 10 µm, 928 ± 3 µm and 1,115 ± 74 µm.
What did they call them? Fine, medium and coarse. For drip.
And Frost’s paper explains why they had to say so explicitly:
“The coffee industry lacks standardized names for specific grind sizes.”
They go further, and this is the sentence that matters for anyone holding a chart:
“We emphasize that these designations might differ from descriptions sometimes used qualitatively in the coffee industry; the grind sizes used here were chosen to bracket the range of grind sizes commonly used for drip brew.”
So a laboratory deliberately bracketing normal drip brewing ran from 770 to 1,115 µm. The charts above put pour over between 400 and 950 µm, and put 770 to 1,115 µm in the French press row.
| The grind in question | Where it sits |
|---|---|
| UC Davis, fine for drip | 770 ± 10 µm |
| UC Davis, medium for drip | 928 ± 3 µm |
| UC Davis, coarse for drip | 1,115 ± 74 µm |
| Popular charts, pour over | 400–950 µm |
| Popular charts, French press | 690–1,300 µm |
I want to be careful about what this does and does not prove. That was batch drip — 66 g of coffee and 1,200 g of water through a Breville Precision Brewer — not a V60 on a scale, and the medians are volume-weighted laser diffraction figures. I am not telling you to grind your pour over at 928 µm. The claim is narrower and harder to dismiss: the only instrument-measured medians for filter brewing I could find published do not sit where the charts put them.
Why a single number was never going to work
Ask a physicist what a coffee grind looks like and you do not get a number, you get a shape with two humps.
Ground coffee is bimodal: boulders, whose size is set by the gap between the burrs, and fines produced at the fracture surface as particles break. The two populations are an order of magnitude apart, and a median falls in the valley between them, describing neither.
How lopsided is it? In the EK43 study, counting particles rather than weighing them, 99% of them measured 70 µm or less. In the espresso modelling work, at one grind setting, 99% of particles were under 100 µm and those particles accounted for 80% of the total surface area. The number on your chart — a volume-weighted median of several hundred microns — is describing a small minority of the particles that happens to hold most of the mass.
There is a second reason a median cannot carry the job, and the cleanest statement of it comes from the Zurich group that has measured this most carefully:
“Projecting a full particle size distribution into a single particle size number (e.g. the median) does not allow to characterize sufficiently the extraction dynamics.”
Their working variable instead is the share of fines — the volume fraction under 100 µm — and they make the point that finishes the chart off:
“For a given median grind size, different grinding technologies can yield a different share of fines.”
Two grinders. Same median. Different coffee. A chart organised by microns cannot express that, in principle, no matter how carefully the microns were measured. How much of that difference you can actually taste is a separate question, and it has been measured.
And when you grind finer, the fines do not get finer. There are simply more of them: as the grind setting is reduced “the relative proportion of fines increases, but their size remains constant.” Grinding finer is not sliding a band down a scale. It is changing the ratio of two populations.
The instrument changes the answer
Even if everyone agreed on what to measure, they would not agree on the number, because three different measuring principles are in circulation and they do not read the same particle the same way.
| How it is measured | Used by | What it actually reports |
|---|---|---|
| Laser diffraction | Uman 2016, Cameron 2020, Frost 2019 | A volume-equivalent spherical diameter |
| Dynamic image analysis | Smrke 2024 | Size and shape, from the projected area |
| Sieving | ISO 6668, the SCAA protocol, Kornman’s EK43 test, Córdoba 2019 | Roughly the particle’s width — what fits through an aperture |
Malvern Panalytical, who build the instruments, put the consequence plainly:
“Laser diffraction and sieving can provide similar results when characterising spherical or semi-spherical particles. However, it is not unusual to observe significant differences for non-spherical particles because each technique measures different particle properties.”
Coffee is emphatically not spherical, and it is oily, which the same manufacturer notes makes sieve analysis prone to clumping and blinded mesh. So a sieve figure and a laser figure for the same grind are not interchangeable — and charts mix them freely, without labels.
If you want to check your own grind at home, sieves are the only realistic route, and it is worth knowing what that costs in practice. The set used in the EK43 comparison has a stated hole tolerance of ±20 µm, and its manufacturer told the researchers that 30 to 40 seconds of sifting gets you about 90% of the way there. Their own protocol was two to five minutes per sample, with denatured alcohol wipes every three to six measurements to clear coffee oil off the screens.
Same setting, different grind
Suppose you ignore all of the above and just copy a number off a chart. There is still a problem: your grinder does not produce one grind per setting.
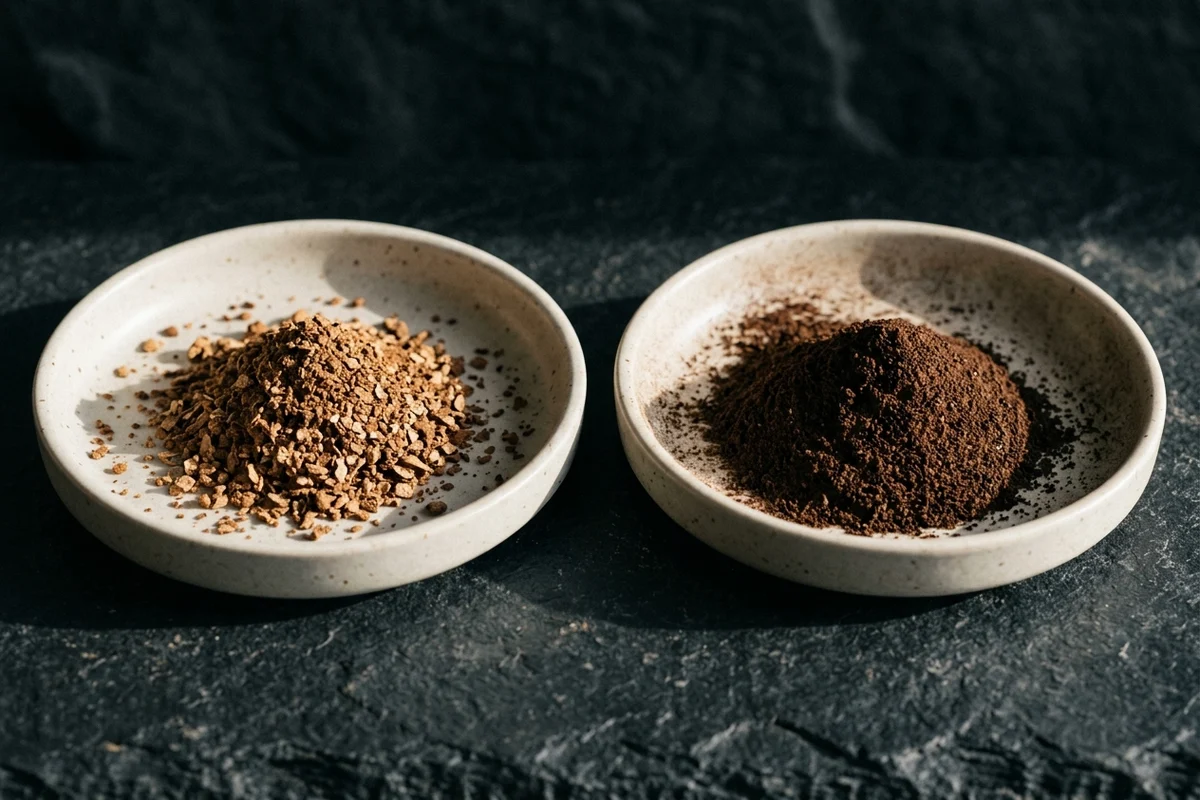
Roast level moves it. In the EK43 study for Roast Magazine, comparing light and dark roasts of the same coffee across all grind settings, the dark roast produced “average differentials of more than 4 percent fewer boulders and chaff, but more than 10 percent more fines.” That is a large change in the variable the Zurich group says matters most, produced without touching the grinder.
This also fills a gap the 2016 laser diffraction study left open on purpose. Those authors found particle size distribution to be essentially independent of bean origin and processing method — good news, and the reason a chart can ignore where your coffee is from — but they were careful to say all their coffees were light to medium roasts, and that they “can only speculate how heavily decomposed beans (e.g. ‘dark’ or French roast) may deviate from these results.” The sieve work answers it: dark roasts deviate, in the direction of more fines.
Temperature moves it too. The same 2016 study ground beans at four temperatures, from a tub of dry ice down to liquid nitrogen and back up to the counter top. The fine particle cutoff moved from 70 ± 3 µm at 20 °C to 61 ± 3 µm at −196 °C, the modal particle size fell by 31%, and the distribution narrowed. The biggest single jump was between room temperature and freezer temperature.
Which is the mechanism behind something every café does without thinking. As the grinder runs, the burrs warm up and the grind coarsens, so you creep the setting finer through the day. The authors say so, and then add the warning that undoes any attempt to rescue the chart with a correction factor:
“Simply grinding finer with warm burrs will not produce the same result as grinding coarsely with cold burrs.”
You can match the median. You cannot match the distribution.
And the number on the dial does not travel. In the same five-grinder test, four EK43 units agreed well at the cupping setting — no more than 0.77 g, or 1.54%, of standard deviation across the screens, and under 0.6% at most of them. But the short-body variant of the same model, from the same manufacturer, “produced finer grounds overall” and had to have its equivalent setting calculated before it lined up, then matched to within 2.25%. If a number does not reliably transfer between two versions of one grinder, it will not transfer from a chart on the internet to the machine on your counter.
What the people who build grinders publish
This is the part I found most telling. Everyone selling coffee publishes a grind chart. The companies that build the grinders mostly do not — and the one that does, measures something other than what you think.
Baratza answers this exact question on its own support page for the Encore, and the answer contains no numbers at all:
“Dialing in means adjusting grind size to brew the perfect cup of coffee, and depends on your brewing device, recipe, coffee beans, and personal tastes. … Small changes to grind size can have a big impact on flavor - too fine can taste bitter, too coarse can taste sour or weak.”
What they give instead is a procedure — hold the recipe still, change one thing, and read the clock:
“…stick with a consistent recipe … using the same water temperature, amount of water, amount of coffee, and technique, all while aiming for the same total brew time each time (meaning you should be timing the brews). That way, only one variable is changing: grind size. … Is the brew taking too long? Grind a bit more coarsely. Brewing too quickly? Grind finer.”
And they close it with “there are no hard and fast rules to making coffee that you love.”
1Zpresso publishes microns, but read what they are microns of: burr movement per click, from 0.008 mm to 0.025 mm depending on the model. That is how far the burrs separate, not how big the particles come out. They publish no brew-method table, and they warn that the outer ring and burr carry enough tolerance that the first clicks off zero may already be in contact.
The DF64’s own grind card carries its own disclaimer on the face of it: use the chart as a starting reference, then adjust to taste, because “there’s no one-size-fits-all: your preferred grind depends on beans, brew method, and personal taste.”
Mahlkönig is the exception that proves the rule. They do publish per-method ranges — 200–400 µm for espresso, 500–800 for pour over, 800–1,000 for French press, 700–900 for cold brew — described as starting points. Two things about that table are worth more than the numbers in it.
First, it contradicts the consensus. Every popular chart makes cold brew the coarsest method on the list. Mahlkönig’s cold brew range is finer than its French press range. And on that specific row, the manufacturer has the better of the argument: the peer-reviewed cold brew study I could find used a coarse grind of 701 to 900 µm, which is Mahlkönig’s row almost exactly, and well below the 900–1,500 µm the charts recommend.
Second, the measurement technology the article describes is Disc Distance Detection, which measures “the exact gap between burrs to 0.001mm (one micron) accuracy.” That is a genuinely impressive instrument, and it is measuring the same thing 1Zpresso’s per-click figure measures: the gap, not the grounds.
Which is the real problem with micron charts, stated precisely. Microns are not a lie. They are a real unit measuring a real thing. They are just frequently measuring the machine rather than the coffee, and nobody says which.
So what has actually been measured?
Here is everything I could source, with the instrument named, because by now it should be clear why that matters.
| Method | The measured figure | Source and instrument | The catch |
|---|---|---|---|
| Cupping | 70% above 600 µm · 20% above 425 µm · 10% below 425 µm | ISO 6668:2008, ISO 565 sieves | For sensory analysis, not for drinking |
| Cupping | 70–75% passes 850 µm | SCAA protocol, 2005 | Satisfied by five different settings on one grinder |
| Drip, conical basket | >850 µm ≤12% · 425–850 µm ≥68% · <425 µm ≤20% | SCA 310-2021, Table 2 | A brewer certification test, and it is about the basket |
| Drip, flat basket | >1,168 µm ≤17% · 589–1,168 µm ≥65% · <589 µm ≤18% | SCA 310-2021, Table 2 | Same; the clause text says 1,198 µm |
| Drip | 770 ± 10 · 928 ± 3 · 1,115 ± 74 µm | Batali 2020 · Frost 2019, laser diffraction | Batch brewer, 66 g into 1,200 g |
| Cold brew | 501–700 µm “medium” · 701–900 µm “coarse” | Córdoba 2019, NTC 2441 granulometry | Sieve-based; a different measuring principle again |
| Espresso | Caffeine per cup rose moving from 500–1,000 µm to 200–300 µm | Severini and colleagues | Two chosen brackets, not a recommendation |
| French press | — | nothing found | |
| Moka pot | — | nothing found | |
| AeroPress | — | nothing found | |
| Turkish | — | nothing found |
Those four empty rows are the honest result of the search, and I am leaving them empty. Filling them by averaging what other sites say would be the exact thing this article is about.
What I would actually do
Not “grind to 700 µm,” because you cannot verify that and neither can the page that told you to. Three things instead, in order of how much they are worth.
1. Use your own grinder’s numbers, and treat them as local. Your grinder’s settings are a perfectly good scale as long as you never expect them to mean anything on someone else’s machine. That is not a failure of your grinder. Two versions of the same professional model needed a translation step before they matched, and 1Zpresso’s own documentation says the zero point itself carries tolerance.
2. Time the brew, because that is the number that transfers. This is what Baratza tells its own customers, and it is the same logic the dial-in method runs on. Hold the dose, the water, the temperature and the technique still, then move only the grind and watch what happens to the clock: running long, go coarser; running fast, go finer. A brew time is a genuine measurement you can make in your kitchen, unlike a micron figure. It only works if everything else really is held still, which is where weighing the dose stops being optional.
3. Re-dial when the coffee changes, not just when the method does. A darker roast at the same setting is a different grind — more than 10% more fines, measured. A warm grinder at the end of a busy morning is a different grind. And what you are really adjusting when you move that dial is how much of the bed is fines, which is why the same number on the same machine can give you a different cup in July than in January.
If you want a starting point rather than a rule, use the one your grinder’s manufacturer publishes for your specific model, and use the tactile descriptions rather than the micron figures — they turn out to hold up better. Moccamaster tells its own customers to grind “medium-coarse, like sea salt or rough sand” for their brewers. That description, with no numbers in it at all, lands squarely in the 770 to 1,115 µm band the laboratory actually measured for drip.
The chart was never the problem. The problem is that it was published without the one sentence that would have made it useful: who measured this, with what, and on which coffee.
Sources
Every figure in this piece traces to one of these. Dates are when the source was read — lists and prices move.
- ISO 6668:2008 — Green coffee: Preparation of samples for use in sensory analysis International Organization for Standardization, second edition, 1 June 2008 Clause 6.4 and Table 1 read in the standard's own text via the publisher's preview PDF. Source of the three-band sieve distribution — 70% retained on 600 µm, 20% retained on 425 µm, 10% through 425 µm, with maxima and minima — of the requirement that the sieves comply with ISO 565 R 40/3, and of the instruction to perform a test sieving at the start of each working day. Read 17 September 2026
- SCAA Cupping Protocols Specialty Coffee Association of America, April 2005 Cupping Committee Read in full. Source of the grind clause: particle size slightly coarser than typically used for paper filter drip brewing, with 70% to 75% of the particles passing through a U.S. Standard size 20 mesh sieve. Read 17 September 2026
- SCA Standard 310-2021: Home Coffee Brewers — Specifications and Test Methods Specialty Coffee Association Clause 7.1.3 and Table 2 read in full via the same public mirror used for the Golden Cup piece. Source of the two grind distributions for brewer testing, one for conical and one for flat brew baskets, and of the statement that the distribution is chosen depending on the shape of the brew basket. The clause text gives the flat-basket band as 589–1198 µm while Table 2 gives 589–1168 µm; both are reported here. Read 17 September 2026
- Effect of Basket Geometry on the Sensory Quality and Consumer Acceptance of Drip Brewed Coffee Frost, Ristenpart & Guinard — Journal of Food Science (2019) Full text read. Source of the statement that the coffee industry lacks standardized names for specific grind sizes, of the three median particle sizes of approximately 800, 1,000 and 1,200 µm named fine, medium and coarse for drip, and of the instrument: a Sympatec HELOS/RODOS laser analyser with an 18–3,500 µm lens, measured in triplicate. Read 17 September 2026
- Brew temperature, at fixed brew strength and extraction, has little impact on the sensory profile of drip brew coffee Batali, Ristenpart & Guinard — Scientific Reports 10, 16450 (2020) Open access, read in full. Source of the measured medians for the same three grinder settings — 770 ± 10 µm, 928 ± 3 µm and 1,115 ± 74 µm — across a study of 27 sample types and 270 separate brews. Read 17 September 2026
- The effect of bean origin and temperature on grinding roasted coffee Uman, Colonna-Dashwood, Colonna-Dashwood, Perger, Klatt, Leighton, Miller, Butler, Melot, Speirs & Hendon — Scientific Reports 6, 24483 (2016) Open access, read in full. Source of the finding that 99% of the particles from an EK43 measured 70 µm or less by number, of the fine-particle cutoffs at four bean temperatures, of the 31% reduction in the modal particle size on cooling to −200 °C, and of the conclusion that grinding finer with warm burrs does not reproduce the result of grinding coarsely with cold burrs. Light to medium roasts only; the authors say dark roasts were not tested. Read 17 September 2026
- Systematically Improving Espresso: Insights from Mathematical Modeling and Experiment Cameron, Morisco, Hofstetter, Uman, Wilkinson, Kennedy, Fontenot, Lee, Hendon & Foster — Matter 2(3), 631–648 (2020) Read in full. Source of the boulder and fines definitions either side of 100 µm, of the figure that 99% of particles at one grind setting were under 100 µm and accounted for 80% of the surface area, and of the observation that grinding finer raises the proportion of fines while their size stays constant. Read 17 September 2026
- The role of fines in espresso extraction dynamics Smrke, Eiermann & Yeretzian — Scientific Reports 14, 5612 (2024) Open access, read in full. Source of the statement that projecting a full particle size distribution into a single number such as the median does not sufficiently characterise extraction dynamics, and of the observation that different grinding technologies can produce a different share of fines at the same median grind size. Measured on a Retsch Camsizer X2 imaging analyser. Read 17 September 2026
- Grinder Alignment: An Evaluation of Consistency, Cupping Settings, and the Impact of Roast Degree Chris Kornman and Elise Becker, with Sandra Elisa Loofbourow — Royal Coffee / The Crown, 4 August 2021; first published in Roast Magazine, May–June 2021 Read in full. Five Mahlkönig EK43 units sifted on seven Kruve screens from 1,600 down to 400 µm. Source of the finding that the SCA cupping specification is satisfied anywhere between settings 4 and 9 on their calibrated grinder and of the authors' description of it as poorly defined, of the unit-to-unit agreement figures, of the short-body variant grinding finer, of the roast-degree differential of more than 10% more fines, and of the Kruve hole tolerance of ±20 µm. Trade press, not peer-reviewed; method and screen-by-screen figures published. Read 17 September 2026
- Effect of grinding, extraction time and type of coffee on the physicochemical and flavour characteristics of cold brew coffee Córdoba, Pataquiva, Osorio, Moreno & Ruiz — Scientific Reports 9, 8440 (2019) Open access, read in full. Source of the two cold brew grind levels used — an average particle size of 501 to 700 µm for medium and 701 to 900 µm for coarse — measured by granulometric distribution under the Colombian technical standard NTC 2441, and of the finding that the highest sensory scores came from the coarse grind at the shortest extraction time rather than the highest extraction yield. Read 17 September 2026
- Laser diffraction vs. sieving, and Measuring the particle size distribution of coffee grounds using laser diffraction Malvern Panalytical; application note dated 20 December 2012 Source of the statement that it is not unusual to observe significant differences between laser diffraction and sieving for non-spherical particles because each technique measures different particle properties, and of the instrument maker's own note that coffee's oil content makes sieve analysis prone to clumping and mesh blinding. Read 17 September 2026
- Encore product support: How do I dial in my grind size for my brew method? Baratza (Breville USA) The grinder manufacturer's own answer to the question this article is about. It gives no per-method setting numbers at all; it gives a procedure — hold the recipe, water, dose and technique constant, time every brew, and move the grind by what the brew time does. Source of the quoted lines, including that there are no hard and fast rules. Read 17 September 2026
- Coffee Grind Size Chart and grind setting reference 1Zpresso Publishes burr movement per click in millimetres for each model — from 0.008 mm to 0.025 mm — and no brew-method table. Also the source of the manufacturer's own caution that the outer ring and burr carry a slight tolerance, so the first few clicks from zero may already be in contact. Read 17 September 2026
- Microns & Grind Consistency: The Science Behind Better Coffee Mahlkönig, 6 April 2026 The one grinder manufacturer in this article that does publish per-method micron ranges: 200–400 for espresso, 500–800 for pour over, 800–1,000 for French press and 700–900 for cold brew, described as starting points. Also the source of the description of Disc Distance Detection as measuring the gap between the burrs to 0.001 mm, which is a burr gap rather than a particle size. Read 17 September 2026
- Coffee Grind Size Chart Honest Coffee Guide Cited for what it is: the most visible grind chart on this search, and the only one that states where its numbers come from. Its stated method is hands-on research and feedback from coffee enthusiasts. Ranges quoted here were read from the page on the date above; these pages are edited without notice. Read 17 September 2026