
Almost certainly not, and the certification everyone cites does not check the thing they think it checks.
The two numbers — 1.15–1.35% strength, 18–22% extraction — are real, and they are the SCA’s. But they come from a 1957 paper, they describe drip coffee only, and the standard the SCA actually certifies coffee makers against today quotes neither of them. It asks for a brew strength of 1.15–1.55%, a window whose upper end sits well outside the box printed on the chart.
Affiliate links. Some product names below link to Amazon. If you buy through one I earn a commission at no extra cost to you, and it never changes which product gets named or what the measurements say. Full disclosure.
None of that makes the numbers useless. It makes them a starting point you can check rather than a verdict you have to accept. Below: where each figure comes from, what a certification sticker really promises, and the arithmetic for measuring your own brew with a scale and a refractometer.
The two numbers, and where they come from
The wording is in the SCA’s Coffee Standards, revised 2018, under the heading Golden Cup Standard:
Coffee shall exhibit a brew strength, measured in Total Dissolved Solids, of 11.5 to 13.5 grams per liter, corresponding to 1.15 to 1.35 percent on the SCA Brewing Control Chart, resulting from a solubles extraction yield of 18 to 22 percent.
Two different quantities, and conflating them is the single most common mistake in this subject.
Brew strength (TDS) is how much dissolved coffee is in the cup, as a fraction of the liquid’s mass. It is what your tongue reads as strong or weak. Extraction yield is how much of the dry coffee you managed to dissolve, as a fraction of the grounds you started with. It is what your tongue reads as sour and thin, or harsh and drying. You can brew a weak cup at a perfect extraction, and a very strong cup that is badly under-extracted. The chart exists precisely because the two move independently.
The third axis, running diagonally across the chart, is the brew ratio that connects them. Version 3 of the SCA Brewing Control Chart — the current one, revised March 2019 — plots strength from 0.90% to 1.80% up the side, extraction from 14% to 26% along the bottom, and rules diagonals from 1:12 to 1:22 coffee-to-water by weight. Fix any two and the third follows. The small rectangle in the middle is labelled, in the SCA’s own type, “SCA Ideal”. Around it sit eight zones with names like Weak & Underextracted and Strong & Overextracted.
That box is older than the association that prints it. Its origin is a 1957 publication by Ernest E. Lockhart of the Coffee Brewing Institute, The Soluble Solids in Beverage Coffee as an Index to Cup Quality, which proposed that measuring dissolved solids could stand in for measuring quality. Nearly seventy years later, the chart is still the backbone of coffee training worldwide — and, as the section below sets out, its central claim has been re-examined by the people who now advise the SCA.
What an SCA certification sticker actually promises
This is the part that is worth reading closely, because it is not what the marketing copy around it says.
The relevant document is SCA Standard 310-2021, Home Coffee Brewers: Specifications and Test Methods, © 2022, the standard behind the Certified Home Brewer programme. Its expert group included manufacturers (Breville, OXO, De’Longhi, Bonavita, Ratio), the European Coffee Brewing Centre, and William Ristenpart of UC Davis.
Read in full, on 3 September 2026, it contains no occurrence of the word “Golden”, no “18–22%”, and no “1.35%”. Its one target is stated in the definitions:
Target extraction parameters. For this standard, target extraction parameters shall be a brew strength of 1.15-1.55% at the standard brew ratio.
The standard brew ratio is 55 grams of coffee per 1.000 kg of fresh water at 17±3 °C. Here is the rest of what a certified machine has to do:
| Requirement | What SCA-310 specifies |
|---|---|
| Resulting brew | Brew strength 1.15–1.55% at the standard brew ratio, at full capacity |
| Brewing temperature | Slurry at 90–96 °C by the time 33% of the water has been sprayed, and held there for the rest of the cycle |
| Uniformity of extraction | Rating of 60 or above (60 “good”, above 75 “excellent”, above 90 “outstanding”) |
| Uniformity of performance | Three separate units, five cycles each, all landing in spec |
| Holding carafe | If heated, 80–85 °C for the first 30 minutes, never above 85 |
| Documentation | The manual must state a grind recommendation, a 55 g/kg ratio, a filter type and cleaning instructions |
Three things follow, and they matter more than the sticker.
First, the certification window is wider than the chart’s box. Extraction yield is not measured directly; it falls out of strength once the ratio and the liquid retained by the spent bed are known. Using the liquid-retention ratio of about 2.1 grams of water per gram of grounds published in the Guinard paper below, a 1 kg batch at 55 g/kg leaves roughly 884 g of liquid coffee, so extraction yield ≈ strength × 16.1. That arithmetic is mine, not the standard’s, and the retention figure is an average rather than a constant — but it puts the certified window at:
| Brew strength | Extraction yield at 55 g/kg (derived here, not in the standard) |
|---|---|
| 1.15% — bottom of both windows | ≈ 18.5% |
| 1.35% — top of the Golden Cup box | ≈ 21.7% |
| 1.55% — top of the certification window | ≈ 24.9% |
The classic pairing is internally consistent: at 55 g/kg, 1.15–1.35% really does land inside 18–22%. The certification ceiling does not. A machine can be certified while brewing at an extraction that the chart it descends from labels Overextracted.
Second, certification is a statement about the machine, not about your cup. During testing, the grind is adjusted — within a specified particle distribution — until the machine hits the target. The water is specified too: odour-free, chlorine-free, 50–175 ppm calcium hardness, 40–70 ppm alkalinity, pH 6–8 — the SCA water standard, which is a separate argument and a separate piece. The coffee is 100% arabica, medium roast, one to one and a half weeks off roast. A sticker means this machine can land in the window when everything around it is right. It says nothing about your grinder, your water or your supermarket beans.
Third, the certification is narrower in scope than people assume. SCA-310 covers electric filter brewers for home use at atmospheric pressure and explicitly excludes pour-over devices, French press, home espresso machines, pressurised brewers and pod machines. If your machine is not a drip machine, this standard has nothing to say about it. Neither does the chart.
Measuring your own brew
Two instruments, and only one of them is expensive.
A scale that reads to 0.1 g — a Hario V60 Drip Scale or anything comparable — does most of the work, because both terms in the extraction formula are masses. Whether you need the second instrument at all is a real question, and the honest answer is in the FAQ below.
The formula is the whole method:
Extraction yield (%) = TDS (%) × beverage mass (g) ÷ dry dose (g)
So: weigh the dose. Brew. Weigh the liquid coffee that actually reaches the cup or carafe — not the water you poured in, since a meaningful fraction stays in the grounds. Read the TDS. Multiply and divide.
A worked example, at the certification’s own ratio. Dose 55.0 g, water 1000 g, and 884 g of coffee in the carafe when it is done. The meter reads 1.28%.
1.28 × 884 ÷ 55.0 = 20.6% extraction yield
Strength 1.28%, yield 20.6% — near the middle of the old box, and comfortably inside the certification window.
If you cannot weigh the beverage — a machine that brews straight into a fixed carafe, say — estimate it as water in − (2.1 × dose). It is an approximation, the retention varies with basket shape and grind, and it should be labelled as an estimate whenever you write the number down.
Getting an honest reading
Two practical points, both worth more than the choice of instrument.
Filter the sample, and be consistent about it. Coffee carries suspended particles and oils that bend light without being dissolved, so an unfiltered sample reads high. Socratic Coffee’s 2015 comparison of the VST LAB Coffee II, VST LAB Coffee III and Atago PAL-COFFEE — twelve samples, three readings each — found no statistically significant difference between the three instruments, but a significant effect from filtering (p = 0.00). The device you buy matters less than whether you treat every sample the same way. This bites hardest with espresso, which carries far more suspended solids than filter coffee.
Let the sample cool, and rinse between readings. A refractometer’s correction assumes a sample near its calibration temperature; a hot sample drifts. Distilled water between samples, and a zero on distilled water before a session, cost nothing.
Espresso is not on this chart
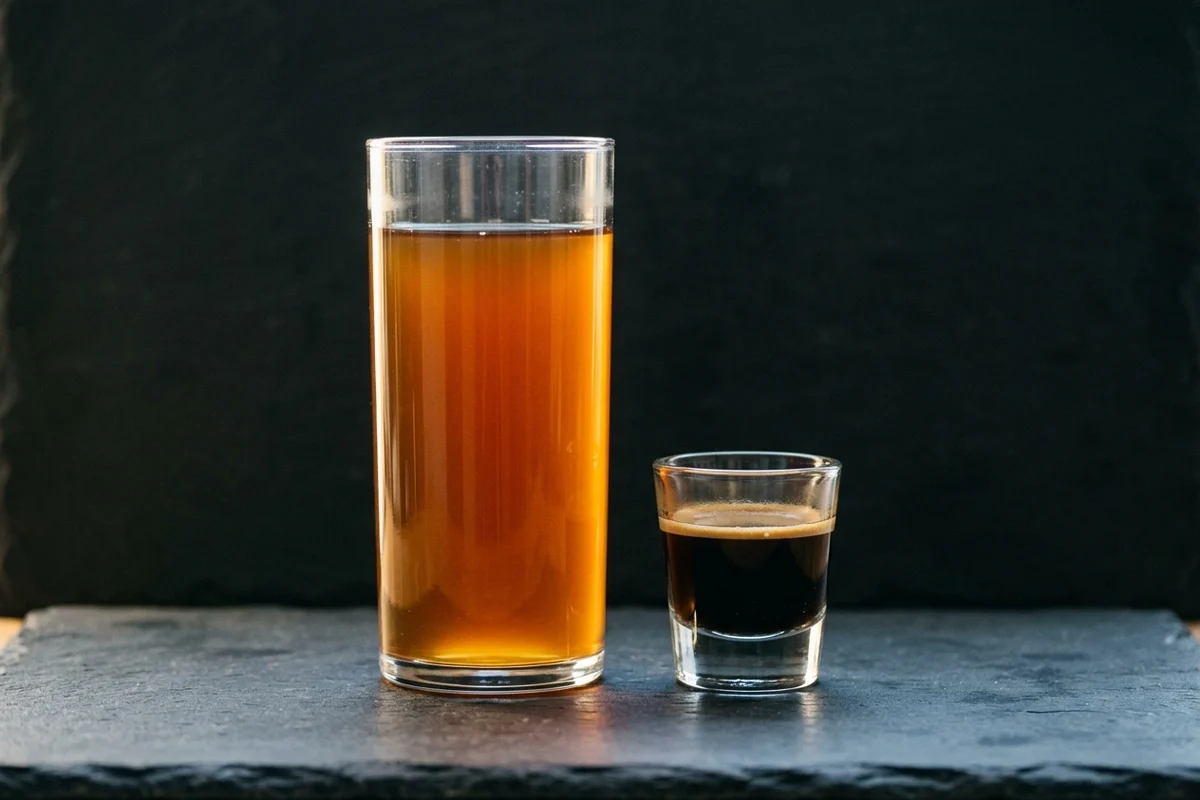
The Brewing Control Chart, the Golden Cup wording and SCA-310 all describe drip coffee. The 18–22% figure has migrated to espresso by habit rather than by evidence, and espresso behaves differently enough that the migration is worth resisting.
The clearest demonstration is Cameron et al.’s 2020 paper in Matter. Their model, assuming water flows evenly through the puck, predicts extraction yield falling steadily as the grind gets coarser. Measured shots did not do that. Yield peaked at an intermediate setting and fell off at both ends — lower at very coarse and at very fine — which is the signature of water finding channels through a finely ground bed instead of soaking through it. Under those conditions a single yield number describes an average across a puck that extracted very unevenly, and two shots at the same measured yield can taste nothing alike.
There is a separate piece on what extraction actually means at the level of the grounds. For espresso specifically, the number is still useful as a relative measure — same beans, same basket, one variable changed — and close to useless as an absolute target.
The uncomfortable part: “ideal” is doing a lot of work
The best argument against treating the box as a destination comes from the SCA’s own research programme.
In 2023, Jean-Xavier Guinard, Scott Frost, Mackenzie Batali, Andrew Cotter, Lik X. Lim and William Ristenpart published a new set of Brewing Control Charts in the Journal of Food Science, synthesising three earlier studies: 324 chemical and physical measurements, 32,076 trained-panel sensory measurements, and 3,186 consumer liking scores across coffees brewed systematically at 1%, 1.25% and 1.5% TDS and 16%, 20% and 24% extraction.
The consumers did not agree with each other. Cluster analysis found two groups. The larger, 57% of consumers, liked coffees in the lower-left of the chart — low strength, low-to-medium extraction, peaking around 18% — which the authors read as a dislike of bitterness more than a love of anything in particular. The other 43% produced a saddle: they liked two opposite things equally, either acidic and fruity at low extraction, or roasted, thick and ashy at high extraction. Neither group’s peak sits in the middle of the chart.
The authors are direct about what this means for the box. Average the whole panel together and maximum liking does land near the classic ideal point — but that average describes nobody, because it is the midpoint between two groups who want different cups. In their streamlined chart they keep the rectangle for familiarity and relabel it: not ideal, but “classic standard”, on the stated grounds that it is unclear which consumers ever found those conditions ideal.
One honest limit, which they state themselves: the consumers were young Northern Californian black-coffee drinkers. A different population could well split differently.
So what is the number for?
It is a diagnostic, not a grade.
Taste tells you a cup is wrong. It is unreliable at telling you why, because thin-and-sour and thin-and-weak feel similar in the mouth and have opposite fixes — one wants a finer grind, the other wants more coffee. Strength and yield separate those two cases in about thirty seconds, and that is the entire value of the measurement.
Practically, that means:
- Measure to find your own box, not to reach theirs. Log strength and yield next to a one-line tasting note for a week. The coordinates of the cups you actually finished are worth more than any published rectangle.
- Trust the ratio before the meter. Brew ratio is free, it is the diagonal that both other numbers hang from, and getting the dose and ratio consistent fixes more cups than any meter will.
- Treat a certification as a floor. It says a machine can hit the window with correct grind, correct water and fresh coffee. Two of those three are yours.
- Never quote an espresso yield as though it were a filter yield. Different standard, different scope, different physics.
The most useful thing about the Golden Cup numbers is not that they are right. It is that they are checkable — and now you can check them, including against the standard that supposedly enforces them.
Sources
Every figure in this piece traces to one of these. Dates are when the source was read — lists and prices move.
- SCA Standard 310-2021 — Home Coffee Brewers: Specifications and Test Methods Specialty Coffee Association The document the Certified Home Brewer programme actually runs on. Source of every certification figure here — target strength, temperature band, uniformity rating, brew ratio, grind and water specs. SCA's own copy is behind member login; this is the public mirror, read via the Internet Archive. Read 3 September 2026
- Coffee Standards (revised 2018) — Golden Cup Standard Specialty Coffee Association Source of the 1.15–1.35% / 18–22% wording, quoted verbatim below. Read 3 September 2026
- Coffee Brewing Control Chart, Version 3 (revised March 2019) Specialty Coffee Association Axis ranges, the ratio diagonals, and the box labelled "SCA Ideal". Read 3 September 2026
- A new Coffee Brewing Control Chart relating sensory properties and consumer liking to brew strength, extraction yield, and brew ratio Guinard, Frost, Batali, Cotter, Lim & Ristenpart — Journal of Food Science 88(5), 2168–2177 (2023) Open access. Source of the Lockhart history, the 2.1 liquid-retention ratio, and the consumer-preference findings. DOI checked against Crossref. Read 3 September 2026
- Systematically Improving Espresso: Insights from Mathematical Modeling and Experiment Cameron et al. — Matter 2(3), 631–648 (2020) Extraction yield versus grind setting peaks rather than rising monotonically. DOI checked against Crossref. Read 3 September 2026
- Measuring Total Dissolved Solids: A Refractometer Comparison (Part III — Espresso & Filters) Socratic Coffee Independent comparison of VST LAB Coffee II, VST LAB Coffee III and Atago PAL-COFFEE, filtered against unfiltered. Read 3 September 2026
- Certified — Home Equipment Specialty Coffee Association The live list of certified home brewers. Read 3 September 2026